Understanding SLI: A Comprehensive Guide
SLI most commonly stands for Service Level Indicator in IT service management and site reliability engineering. It is a measurable signal that shows how a service is actually performing, such as whether users can access it, how quickly it responds, or how often requests fail. Understanding SLIs helps teams connect technical performance to customer experience, business risk, and service commitments.
In other contexts, SLI can mean something else, including shipping documentation or older graphics hardware references like SLI cards. This guide focuses first on service reliability, then briefly explains those other meanings so you can interpret the term correctly wherever you see it.
What does SLI stand for in service management?
In service management, SLI stands for Service Level Indicator (SLI), it serves as a measurable metric used to track the performance of a service. If you are asking, “what is an SLI,” the simplest answer is that it is the metric used to determine whether a service is behaving well enough for users.
An SLI is not a vague health score or a general dashboard number. It should measure something meaningful and observable, such as the percentage of successful requests, the time it takes a page to load, or the number of errors users experience. A good SLI gives teams evidence they can act on, rather than a general impression that a system is “up” or “down.”
For example, a payment platform might use successful checkout rate as an SLI. A streaming service might track video startup time or playback failure rate. A cloud application might monitor API availability, request latency, and data durability. The best SLIs are close to the user’s experience, not just the server’s internal condition.
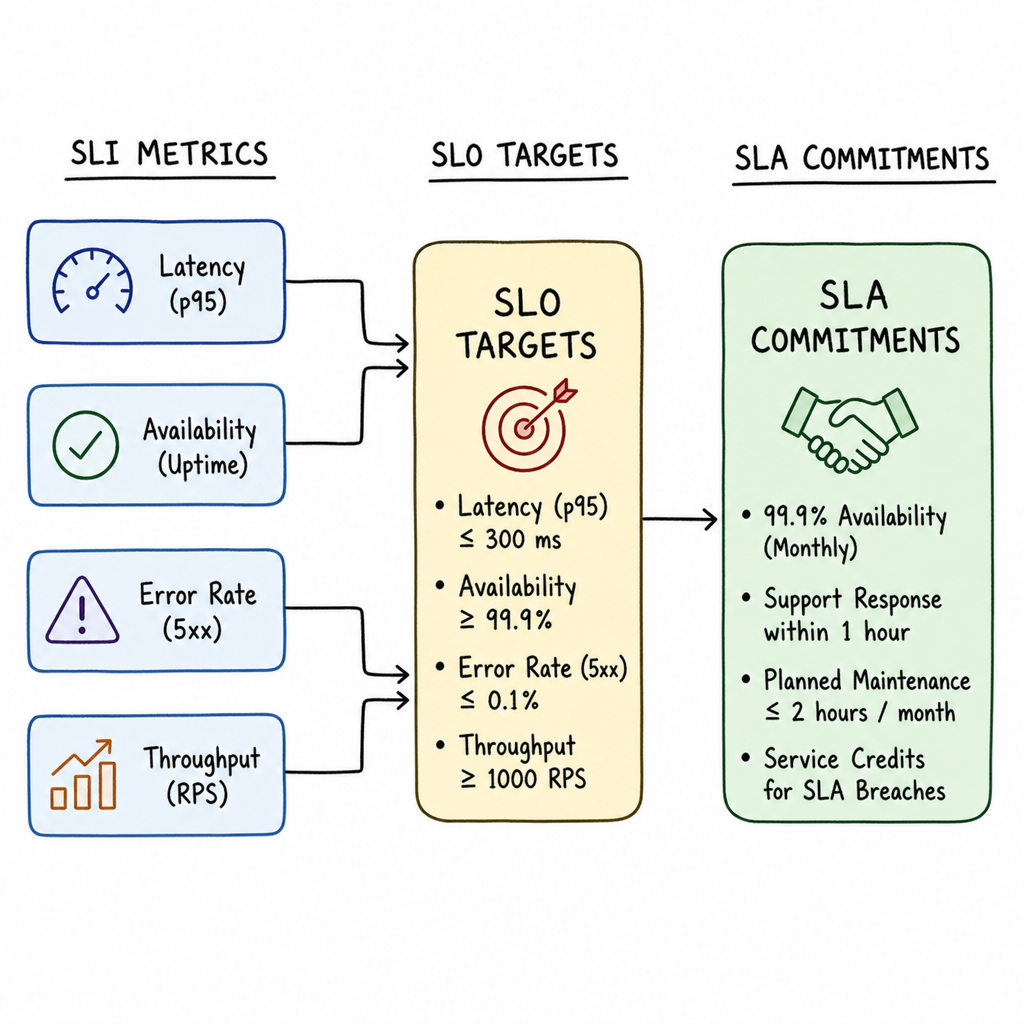
SLI, SLO, and SLA are related but not interchangeable
The sli meaning becomes clearer when you place it beside two related terms: SLO and SLA. These three concepts are often discussed together, but each plays a different role.
| Term | Stands for | Main purpose | Typical audience |
|---|---|---|---|
| SLI | Service Level Indicator | Measures actual service performance | Engineering, operations, product |
| SLO | Service Level Objective | Sets an internal performance target | Engineering, product, leadership |
| SLA | Service Level Agreement | Defines an external commitment or contract | Customers, vendors, legal, sales |
Think of the relationship like a speedometer, a speed target, and a driving agreement. The SLI is the speedometer: it tells you what is happening. The SLO is the target speed: it defines what “good enough” means. The SLA is the formal agreement: it may define what happens if the promised level is not met.
This distinction matters because teams sometimes jump straight to an SLA without building reliable measurement underneath it. That can create confusion during incidents, disputes, or customer reviews. If the SLI is poorly chosen or inconsistently measured, the SLO and SLA built on top of it will be shaky too.
What is SLI used for in real service operations?
SLI is used to measure whether a service is meeting the performance and reliability expectations that matter to users. In practice, teams use SLIs to monitor live systems, detect degradation, evaluate reliability trends, and decide when to prioritize fixes over new feature work.
An SLI helps answer practical questions such as: Are users able to complete important actions? Is the application slower than expected? Are failures increasing in a way that requires escalation? Because SLIs are measurable, they give teams a shared language for reliability rather than relying on opinion or scattered anecdotal reports.
Common uses include:
- Incident detection: A sudden drop in availability or spike in latency can signal a real user-impacting problem.
- Prioritization: If an SLI shows a core workflow is unreliable, teams can justify shifting resources toward stability.
- Error budget tracking: SLIs help show how much unreliability has been “spent” against an SLO.
- Customer communication: Clear metrics make it easier to explain performance without overloading stakeholders with technical details.
- Product decisions: Reliability data can reveal whether a feature is ready to scale or needs more operational work.
The practical value is not just measurement. It is decision-making. A useful SLI should guide what the team does next.
Common examples of strong SLIs
Good SLIs vary by business model, product type, and user journey. Still, several categories appear across many digital services because they reflect experiences users notice quickly.
Availability
Availability measures whether a service is usable when users need it. It is often expressed as the percentage of successful requests over a time window. For example, an API might define availability as the number of valid requests that return successful responses divided by total valid requests.
Availability should be measured from a user-relevant perspective whenever possible. A server may be running, but if customers cannot log in, complete a purchase, or load a dashboard, the service is not meaningfully available to them.
Latency
Latency measures how long a service takes to respond. This could be page load time, API response time, checkout completion time, or another workflow-specific measure. Teams often track latency using percentiles, such as the 95th or 99th percentile, because averages can hide painful slow experiences for a smaller group of users.
Latency is important because a service can be technically available but still frustrating. If a search page loads eventually but takes too long, the user experience may still be poor.
Error rate
Error rate measures how often requests fail. This can include server errors, failed transactions, timed-out requests, or unsuccessful background jobs. A rising error rate often provides an early signal that something is breaking before all users are affected.
Error rate is especially useful when tied to important user actions. A small number of errors in an unused admin panel may not carry the same business impact as errors in account creation, payment processing, or data upload.
Throughput and saturation
Throughput measures how much work a system handles, such as requests per second, messages processed per minute, or orders completed per hour. Saturation measures how close a system is to capacity limits. These metrics may not always be user-facing on their own, but they help explain why user-facing SLIs are changing.
For example, if latency increases whenever throughput rises, the team may need to tune capacity, optimize code, or redesign a bottleneck.
Choosing SLIs that actually matter
Not every available metric deserves to become an SLI. Modern systems can produce thousands of data points, but too many indicators create noise and make it harder to see what matters. The goal is to select a small set of signals that reflect user outcomes and business priorities.
Use this checklist when choosing SLIs:
- Start with key user journeys. Identify the actions users rely on most, such as signing in, searching, checking out, uploading files, or accessing reports.
- Measure outcomes, not just components. CPU usage, memory, and disk space are useful operational metrics, but they do not always show whether users are succeeding.
- Define the calculation clearly. Specify the numerator, denominator, time window, included traffic, and excluded cases.
- Prefer actionable signals. If an SLI changes, the team should know who investigates and what response paths exist.
- Avoid vanity reliability metrics. A metric that always looks good but does not reflect user pain can create false confidence.
- Include real-user or client-side data where useful. Backend systems may look healthy while users experience network, browser, or device-related problems.
A strong SLI is both technically credible and easy enough for non-specialists to understand. If product, support, and leadership teams can grasp what the metric means, it becomes far more useful during planning and incident review.
Turning SLIs into better reliability habits
SLIs become powerful when they are part of a repeatable operating rhythm. A dashboard alone does not improve reliability; teams need practices that turn indicators into decisions.
One useful approach is to connect each important SLI to an SLO. For example, a team may decide that a core API should successfully serve a certain percentage of valid requests during a rolling time window. The SLI measures what happened; the SLO defines the target. If performance falls below the target, the team can investigate causes, reduce risky releases, or prioritize reliability work.
Alerting also needs care. Alerting on every small fluctuation can exhaust teams and train people to ignore warnings. Instead, alerts should focus on meaningful risk: user impact, fast error budget burn, or problems that require timely human action.
A healthy reliability routine often includes:
- Reviewing SLIs regularly to spot trends before they become major incidents.
- Linking alerts to response playbooks so teams know what to check first.
- Using post-incident reviews to improve the SLI, not just the system.
- Revisiting targets when products, traffic patterns, or customer expectations change.
- Keeping business context visible so reliability work supports real priorities.
This is where SLIs move beyond monitoring. They become a way to align engineering effort with customer trust.
A practical way to explain SLIs to stakeholders
When introducing SLIs to non-technical teams, avoid starting with tooling or infrastructure. Start with the customer experience. For example: “We want to know whether users can complete checkout quickly and successfully.” From there, the SLI becomes a measurement of that experience.
A simple explanation can follow this pattern:
- User expectation: Customers need the service to work when they use it.
- SLI: We measure the percentage of successful checkout attempts and how long they take.
- SLO: We set an internal target for acceptable performance.
- SLA: We may make an external promise based on what we can reliably support.
This framing helps legal, sales, product, and engineering teams stay aligned. It also reduces the temptation to promise reliability levels that the system cannot yet measure or sustain.
Key takeaway
SLI means Service Level Indicator in service management, and it answers a simple but important question: how is the service actually performing for users? The strongest SLIs are measurable, user-centered, and tied to decisions about reliability, incidents, and business priorities.
To use SLIs well, keep them focused. Choose indicators that reflect real customer journeys, define them clearly, connect them to SLOs, and review them as part of everyday operations. And when you see the term in another setting, remember that SLI can also refer to shipping instructions or hardware concepts, so context determines the correct meaning.
